Content
- page: Installation and overview of Munin server monitor system
- page: Install, uninstall, and set password protection for Munin plugins
Contents of page 2
Continuation
Az on the first page we have installed the Munin server monitoring software, and on this page we will continue to install and configure the plugins, which will make monitoring of our system even more efficient.
Installing Munin Plugins (Optional)
Installing the Munin plugins is optional, the system already monitors several aspects of the server, but once you have started, make sure that your Munin system is properly configured.
Enable system-recommended plugins
The Munin software package also includes a system analysis section that assesses the optional plug-ins based on the hardware and software services running on the machine, which it recommends after a quick runtime test, or in the event of a malfunction, reports that the plugin in question does not work in that system environment. .
When you installed Munin, you already performed this analysis by default, and enabled any add-ons from your repository as per the server environment. However, if you upgrade your server with new features later, you might want to manually run this analysis again to see if you can find another functional plugin that monitors our new services.
To start it manually, run the following command:
munin-node-configure --suggestWait a little while for the analysis to run and then release the results.
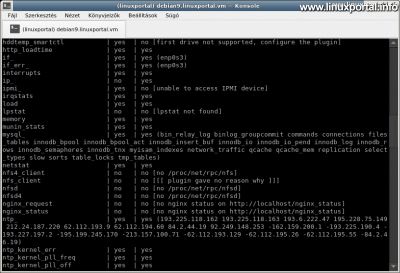
Output on Debian 9 perfect server:
Plugin                     | Used | Suggestions
------                     | ---- | -----------
acpi                       | no   | no [[[ plugin has errors, see below ]]]
amavis                     | no   | no [command logtail or file /var/log/mail.info not found]
apache_accesses            | yes  | yes
apache_processes           | yes  | yes
apache_volume              | yes  | yes
apc_envunit_               | no   | no [no units to monitor]
bonding_err_               | no   | no [No /proc/net/bonding]
courier_mta_mailqueue      | no   | no [spooldir not found]
courier_mta_mailstats      | no   | no [could not find executable]
courier_mta_mailvolume     | no   | no [could not find executable]
cps_                       | no   | no [ipvsadm not found]
cpu                        | yes  | yes
cpuspeed                   | no   | no [neither /sys/devices/system/cpu/cpu0/cpufreq/stats/time_in_state nor /sys/devices/system/cpu/cpu0/cpufreq/scaling_cur_freq is readable]
cupsys_pages               | no   | no [could not find logdir]
df                         | yes  | yes
df_inode                   | yes  | yes
digitemp_                  | no   | no [failed to find executable starting with 'digitemp_']
diskstats                  | yes  | yes
entropy                    | yes  | yes
exim_mailqueue             | no   | no [command exiqgrep not found]
exim_mailstats             | no   | no [logdir '/var/log/exim4/' does not exist]
fail2ban                   | yes  | yes
forks                      | yes  | yes
fw_conntrack               | no   | no [command /usr/sbin/conntrack or file /proc/net/nf_conntrack or file /proc/net/ip_conntrack not found]
fw_forwarded_local         | no   | no [command /usr/sbin/conntrack or file /proc/net/nf_conntrack or file /proc/net/ip_conntrack not found]
fw_packets                 | yes  | yes
hddtemp_smartctl           | no   | no ['smartctl' executable not found]
http_loadtime              | yes  | yes
if_                        | yes  | yes (enp0s3)
if_err_                    | yes  | yes (enp0s3)
interrupts                 | yes  | yes
ip_                        | no   | yes
ipmi_                      | no   | no [missing ipmitool command]
irqstats                   | yes  | yes
load                       | yes  | yes
lpstat                     | no   | no [lpstat not found]
memory                     | yes  | yes
munin_stats                | yes  | yes
mysql_                     | no   | no [Missing dependency Cache::Cache]
netstat                    | yes  | yes
nfs4_client                | no   | no [no /proc/net/rpc/nfs]
nfs_client                 | no   | no [[[ plugin gave no reason why ]]]
nfsd                       | no   | no [no /proc/net/rpc/nfsd]
nfsd4                      | no   | no [no /proc/net/rpc/nfsd]
nginx_request              | no   | no [no nginx status on http://localhost/nginx_status]
nginx_status               | no   | no [no nginx status on http://localhost/nginx_status]
ntp_                       | yes  | yes (193.225.118.163 193.6.222.47 195.228.75.149 62.112.193.9 84.2.44.19 92.249.148.253 +162.159.200.123 +193.225.118.162 +212.24.187.220 +212.92.16.193 +62.112.194.60 -162.159.200.1 -193.225.190.4 -193.227.197.2 -195.199.245.170 -213.157.100.71 -62.112.193.129 -62.112.195.26 -62.112.195.55 -84.2.46.19)
ntp_kernel_err             | yes  | yes
ntp_kernel_pll_freq        | yes  | yes
ntp_kernel_pll_off         | yes  | yes
ntp_offset                 | yes  | yes
ntp_states                 | yes  | yes
nvidia_                    | no   | no [no nvclock executable at /usr/bin/nvclock, please configure]
open_files                 | yes  | yes
open_inodes                | yes  | yes
pgbouncer_connections      | no   | no [DBD::Pg not found, and cannot do psql yet]
pgbouncer_requests         | no   | no [DBD::Pg not found, and cannot do psql yet]
postfix_mailqueue          | yes  | yes
postfix_mailvolume         | yes  | yes
postgres_autovacuum        | no   | no [[[ plugin has errors, see below ]]]
postgres_bgwriter          | no   | no [[[ plugin has errors, see below ]]]
postgres_cache_            | no   | no [[[ plugin has errors, see below ]]]
postgres_checkpoints       | no   | no [[[ plugin has errors, see below ]]]
postgres_connections_      | no   | no [[[ plugin has errors, see below ]]]
postgres_connections_db    | no   | no [[[ plugin has errors, see below ]]]
postgres_locks_            | no   | no [[[ plugin has errors, see below ]]]
postgres_oldest_prepared_xact_ | no   | no [[[ plugin has errors, see below ]]]
postgres_prepared_xacts_   | no   | no [[[ plugin has errors, see below ]]]
postgres_querylength_      | no   | no [[[ plugin has errors, see below ]]]
postgres_scans_            | no   | no [[[ plugin has errors, see below ]]]
postgres_size_             | no   | no [[[ plugin has errors, see below ]]]
postgres_transactions_     | no   | no [[[ plugin has errors, see below ]]]
postgres_tuples_           | no   | no [[[ plugin has errors, see below ]]]
postgres_users             | no   | no [[[ plugin has errors, see below ]]]
postgres_xlog              | no   | no [[[ plugin has errors, see below ]]]
proc                       | no   | no [[[ plugin has neither autoconf not suggest support ]]]
proc_pri                   | yes  | yes
processes                  | yes  | yes
qmailqstat                 | no   | no [file /var/qmail/bin/qmail-qstat not found]
selinux_avcstat            | no   | no [missing /sys/fs/selinux/avc/cache_stats file]
sendmail_mailqueue         | no   | no [[[ plugin has errors, see below ]]]
sendmail_mailstats         | no   | no [[[ plugin has errors, see below ]]]
sendmail_mailtraffic       | no   | no [[[ plugin has errors, see below ]]]
sensors_                   | no   | no [program sensors died]
slapd_                     | no   | no [Connection refused]
slapd_bdb_cache_           | no   | no [Can't execute db_stat file '/usr/bin/db4.6_stat']
slony_lag_                 | no   | no [DBD::Pg not found, and cannot do psql yet]
smart_                     | no   | no [smartmontools not found]
snort_alerts               | no   | no [/var/snort/snort.stats not readable]
snort_bytes_pkt            | no   | no [/var/snort/snort.stats not readable]
snort_drop_rate            | no   | no [/var/snort/snort.stats not readable]
snort_pattern_match        | no   | no [/var/snort/snort.stats not readable]
snort_pkts                 | no   | no [/var/snort/snort.stats not readable]
snort_traffic              | no   | no [/var/snort/snort.stats not readable]
squeezebox_                | no   | no [no connection on localhost port 9090]
squid_cache                | no   | no [could not connect: Connection refused]
squid_objectsize           | no   | no [could not connect: Connection refused]
squid_requests             | no   | no [could not connect: Connection refused]
squid_traffic              | no   | no [could not connect: Connection refused]
swap                       | yes  | yes
threads                    | yes  | yes
tomcat_                    | no   | no [could not connect to 127.0.0.1/manager/status?XML=true on port 8080]
uptime                     | yes  | yes
users                      | yes  | yes
varnish_                   | no   | no [[[ plugin has errors, see below ]]]
vmstat                     | yes  | yes
vserver_cpu_               | no   | no [/proc/virtual/info not found]
vserver_loadavg            | no   | no [/proc/virtual/info not found]
vserver_resources          | no   | no [/proc/virtual/info not found]
yum                        | no   | no [Could not run yum]
# The following plugins caused errors:
# acpi:
#       Junk printed to stderr
# postgres_autovacuum:
#       Non-zero exit during autoconf (255)
# postgres_bgwriter:
#       Non-zero exit during autoconf (255)
# postgres_cache_:
#       Non-zero exit during autoconf (255)
# postgres_checkpoints:
#       Non-zero exit during autoconf (255)
# postgres_connections_:
#       Non-zero exit during autoconf (255)
# postgres_connections_db:
#       Non-zero exit during autoconf (255)
# postgres_locks_:
#       Non-zero exit during autoconf (255)
# postgres_oldest_prepared_xact_:
#       Non-zero exit during autoconf (255)
# postgres_prepared_xacts_:
#       Non-zero exit during autoconf (255)
# postgres_querylength_:
#       Non-zero exit during autoconf (255)
# postgres_scans_:
#       Non-zero exit during autoconf (255)
# postgres_size_:
#       Non-zero exit during autoconf (255)
# postgres_transactions_:
#       Non-zero exit during autoconf (255)
# postgres_tuples_:
#       Non-zero exit during autoconf (255)
# postgres_users:
#       Non-zero exit during autoconf (255)
# postgres_xlog:
#       Non-zero exit during autoconf (255)
# proc:
#       In family 'auto' but doesn't have 'autoconf' capability
# sendmail_mailqueue:
#       Non-zero exit during autoconf (255)
# sendmail_mailstats:
#       Non-zero exit during autoconf (255)
# sendmail_mailtraffic:
#       Non-zero exit during autoconf (255)
# varnish_:
#       Non-zero exit during autoconf (2)
The first column shows the name of the plugin, the second column whether it is in use, and the third column whether it is recommended by the system. Below the list is a list of extensions that produced invalid test results. In this situation, extensions beginning with postgres_ have reported an error, which is understandable since this system does not include the PostgreSQL database engine. Similarly, sendmail extensions do not work because Sendmail is not installed (we use Postfix on the server instead).
In the third column of the list, you can also find information about errors related to extensions that cannot be turned on. For example, they cannot read a particular log file or have various dependency issues, and so on. These errors need to be fixed separately and then the plugin can be turned on.
To manually enable plugins:
If you find an add-on in your list that is not enabled but recommended by the system, you can turn it on by using the following directory: / usr / share / munin / plugins to link in the directory of enabled plugins (/ etc / munin / plugins) the given file:
ln -s /usr/share/munin/plugins/<plugin_pontos_neve> /etc/munin/plugins/<plugin_pontos_neve>To enable plugins automatically:
However, there are also extensions that end with a "_" character, not enough to link to the exact filename, but even add a suffix to the symbolic link name that refers to that graph. Therefore, it is better to get an automatic link assembly, which will give us the required shell command lines. To do this, run the following command:
munin-node-configure --suggest --shellHere is the --shell option to switch the program so that you do not give us the list of extensions in the previous tabular form, but the executable ln commands for us with parameters containing the exact filenames. Alternatively, if you want to run the output of this one at a time, that is, to automatically enable all recommended extensions, redirect its output via a pipeline to a shell:
munin-node-configure --suggest --shell | shA complete list of commands beginning with "ln -s" will be executed.
And after enabling the plugins, you should always restart the Munin node:
systemctl restart munin-nodeIP
The "IP_" plugin allows us to monitor our server and one or more IP address data traffic. You may need to use it if you have, for example, a server environment with multiple computers and want to monitor data traffic between servers. For example, if our database server is running from another server, or we are running a secondary name server service on another machine, etc. Normally, in a machine environment there is little point in using it.
The plugin is a "wildcard" plugin, which means you can use it to create multiple graphs (so it is not activated by default). It is enabled by including the IP address you want to monitor in the link name. For example:
ln -s /usr/share/munin/plugins/ip_ /etc/munin/plugins/ip_192.168.1.100
ln -s /usr/share/munin/plugins/ip_ /etc/munin/plugins/ip_192.168.1.101
ln -s /usr/share/munin/plugins/ip_ /etc/munin/plugins/ip_192.168.1.102
So with this logic, we can create any number of links to monitor traffic between our server and an IP address. Each link must point to the same plugin file named "ip_".
After enabling the plugins, restart the Munin node:
systemctl restart munin-node
MySQL
If you run it on the server MySQL server, you may want to enable this plugin group. MySQL is running on this server, but it reports an addiction error in the list above. To fix this, we need to install two packages:
apt-get -y install libcache-{perl,cache-perl}The simplified command installs two packages (libcache-perl and libcache-cache-perl), which of course have additional dependencies, so a total of 5 packages will be installed. Once these are added, you can turn on all the graphs in the MySQL plugin using the method already described above:
munin-node-configure --suggest --shell | shThere are also some plugins that automation does not turn on, but with manual linking we can still get some useful MySQL graphs:
cd /etc/munin/plugins
ln -s /usr/share/munin/plugins/mysql_bytes mysql_bytes
ln -s /usr/share/munin/plugins/mysql_isam_space_ mysql_isam_space_
ln -s /usr/share/munin/plugins/mysql_queries mysql_queries
ln -s /usr/share/munin/plugins/mysql_slowqueries mysql_slowqueries
ln -s /usr/share/munin/plugins/mysql_threads mysql_threadsThen you will still need a /etc/mysql/debian.cnf defaults file, because the plugin reads access to our database server from this file, from which it can then query the data needed to compile statistics. Learn how to configure this file here.
Then restart the Munin node:
systemctl restart munin-nodeThen, if we recheck the plugin in the analytics section:
munin-node-configure --suggestThen you can see that the charts starting with mysql_ are all turned on.
Here, some of the MySQL graphs may not display data, and errors may be thrown in the Munin log file, then these extensions can be disabled. It is entirely up to the server environment that some plugins / graphs do not collect data. But about that later ...
These MySQL graphs are very useful, especially when there is a heavy server load, because they can easily analyze the weaknesses of our server and the web pages it runs on, which we can then fix.
IPMI
The IPMI (Intelligent Platform Management Interface) plugin can be used to measure the temperature of the system and various peripherals such as RAMs. The extension is missing from the list above ipmitol package. To enable this add-on, install:
apt-get -y install ipmitool(Does not work in VirtualBox)
Then turn on the plugin graphs:
ln -s /usr/share/munin/plugins/ipmi_ /etc/munin/plugins/ipmi_temp
ln -s /usr/share/munin/plugins/ipmi_ /etc/munin/plugins/ipmi_fans
ln -s /usr/share/munin/plugins/ipmi_ /etc/munin/plugins/ipmi_power
And don't forget to restart the Munin node ...
systemctl restart munin-nodeHddtemp and sensors
The hddtemp and sensor plugins also allow us to monitor temperatures. I have already made a description in which we could read the temperatures of different hardware on our computer, you will need these packages right now. So install the necessary packages as described on the linked page:
apt-get -y install lm-sensors hddtemp smartmontoolsThen run the sensor detection program:
sensors-detectHere, answer Yes to everything.
Then start the mod services:
systemctl start kmodThen turn on the temperature monitoring plugins:
cd /etc/munin/plugins
ln -s /usr/share/munin/plugins/sensors_ sensors_
ln -s /usr/share/munin/plugins/hddtemp hddtemp
ln -s /usr/share/munin/plugins/hddtemp2 hddtemp2
ln -s /usr/share/munin/plugins/hddtemp_smartctl hddtemp_smartctl
Of course, some of these may not work on a virtual machine.
Finally, restart the Munin node:
systemctl restart munin-nodeInstalling third-party plugins
It is also possible to install additional Munin plugins that you can download from external websites or you can create them yourself. The plugins listed here have been used by many servers for a long time, so I strongly recommend installing and configuring them.
PHP-FPM 1.
A GitHub I found a PHP-FPMplugin, which provides some usable graphs. To download the git program. So first, install git (if you don't already have one on your system):
apt-get install gitEnter the directory where the plugins are available (where they are physically located):
cd /usr/share/munin/pluginsThen, clone the contents of the git directory into this directory:
git clone https://github.com/leprechau/php-fpm-munin-plugins.gitThis created a subdirectory containing the contents of the complete git directory: ./php-fpm-munin-plugins/.
Turn on the plug-in. Since this is an external extension, automatic linking does not work, so create links to the graphs for the extension manually and restart Munin:
ln -s /usr/share/munin/plugins/php-fpm-munin-plugins/phpfpm_check /etc/munin/plugins/phpfpm_average
ln -s /usr/share/munin/plugins/php-fpm-munin-plugins/phpfpm_check /etc/munin/plugins/phpfpm_connection
ln -s /usr/share/munin/plugins/php-fpm-munin-plugins/phpfpm_check /etc/munin/plugins/phpfpm_memory
ln -s /usr/share/munin/plugins/php-fpm-munin-plugins/phpfpm_check /etc/munin/plugins/phpfpm_process
ln -s /usr/share/munin/plugins/php-fpm-munin-plugins/phpfpm_check /etc/munin/plugins/phpfpm_status
service munin-node restart
The graphs of the plugin are available in the following "php" category, which is created when Munin runs. Since this plugin has not been developed since 2013, one or two of these graphs may not collect data. You can safely delete them.
PHP-FPM 2.
There is also a very useful plugin for displaying PHP-FPM graphs, which is also a GitHub we can download it. Run the following commands to download and install:
cd /usr/share/munin/plugins/
wget -O php-fpm https://raw.github.com/MorbZ/munin-php-fpm/master/php-fpm.php
chmod +x php-fpm
ln -s /usr/share/munin/plugins/php-fpm /etc/munin/plugins/php-fpm-memory
ln -s /usr/share/munin/plugins/php-fpm /etc/munin/plugins/php-fpm-cpu
ln -s /usr/share/munin/plugins/php-fpm /etc/munin/plugins/php-fpm-count
ln -s /usr/share/munin/plugins/php-fpm /etc/munin/plugins/php-fpm-time
service munin-node restart
This plugin creates a category called "php-fpm" where we can find the graphs. In these graphs, you can see separate data collection broken down into separate PHP-FPM pools.
pureFTP
If we run PureFTPd on the server FTP server, then it is worth installing the appropriate extension for this as well.
First, install the logtail program used by the plugin to manage the appropriate log file:
apt-get install logtailThen go to the directory where the plugins are stored:
cd /usr/share/munin/pluginsThen create a new file:
nano pure-ftpdAnd copy and paste the exact content here:
https://github.com/munin-monitoring/contrib/blob/master/plugins/ftp/pure-ftpd-logs
Save it and make it executable:
chmod +x pure-ftpdAnd link to the plug-in directory:
ln -s /usr/share/munin/plugins/pure-ftpd /etc/munin/plugins/pure-ftpdThen you need to configure the plugin to run as root, since only root can read the / var / log / syslog file from which this plugin works. To do this, you need to create an option for pureftpd in the plugin configuration directory. You can do this in an existing file, but you can also create a separate file for it. Create a new file to make the system clearer:
nano /etc/munin/plugin-conf.d/pure-ftpdAnd let's add:
[pure-ftpd]
user root
Save and Restart Munin:
service munin-node restartWe'll find a graph of this in the "network" category under "Pure Ftpd Logs" from the next graph refresh cycle.
Remove unnecessary or faulty graphs
The Munin system, although still being developed, has been around for a very long time, so some graphs may simply not collect data or malfunction. There are several ways to discover these.
Overview of Munin log files
One way to find faulty plugins is to look at the Munin node log file. THE / Var / log / munin directory contains log files for the central system and the node. Of these, we now have the munin-node.log we will need to scan the file. Let's also look at the end:
tail -n 20 /var/log/munin/munin-node.logOn the Debian 9 virtual machine, it gives this output:
So here are some mistakes. Of these, the "hddtemp_smartctl" and "sensors_" extensions are designed to monitor hard disk temperatures, but this feature is not supported on a virtual machine, so it is understandable on this machine. In the case of errors starting with "ntp_", it is because Munin is preset NTP some servers either no longer exist or are not available, etc.
It's a good idea to disable these add-ons so they don't run unnecessarily or are full of log files with error messages.
Add-on Testing
Another way to detect malicious plugins is to run the suspicious plugin on Munin's own testing system.
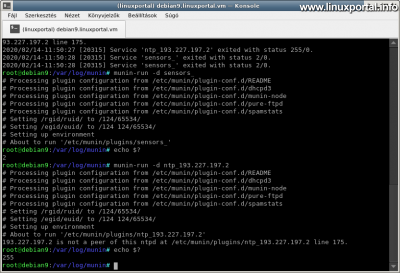
The appropriate command is a munin-run -d. For example, consider "sensors_" or one of the bad ntp_ extensions:
munin-run -d sensors_
munin-run -d ntp_193.227.197.2
The first one seems to have no error, but if we query "?" error variable, it looks like you have exited with error code 2. The second one has a code of 255, and there is also an error message.
This allows us to look at suspicious plugins and test their functionality.
Disable extensions
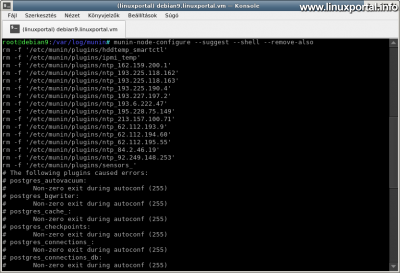
You can disable unnecessary extensions in the way you already know to delete / Etc / munin / plugins directory, and we restart the node. But there is also a more efficient way that the system automatically scans all plug-ins that are enabled and generates the link deletion commands that just run. To do this, enter the following command:
munin-node-configure --suggest --shell --remove-alsoThis will output the created link delete commands to remove unnecessary plug-ins.
If you redirect this command to a shell, it will even execute it for us:
munin-node-configure --suggest --shell --remove-also | shFinally, restart the node:
systemctl restart munin-node
Set password protection for the web interface
When we’re done with everything, there’s only one thing left to do is password protect Munin’s web interface so we can keep it safe from the outside world.
Create the password store file in / etc / munin (where it will be safe):
htpasswd -c /etc/munin/munin_password adminIt will then ask the specified admin user for the password, and then ask for a repeat. The password file is then created. Let's open Munin's Apache configuration file:
nano /etc/munin/apache24.confAnd the parts that were already modified will now be changed again as follows:
[...]
<Directory /var/cache/munin/www>
    #Require local
    #Require all granted
    AuthUserFile /etc/munin/munin_password
    AuthName "Munin"
    AuthType Basic
    Require valid-user
    Options FollowSymLinks SymLinksIfOwnerMatch
    Options None
</Directory>

<Directory /usr/lib/munin/cgi>
    #Require local
    #Require all granted
    AuthUserFile /etc/munin/munin_password
    AuthName "Munin"
    AuthType Basic
    Require valid-user
    Options FollowSymLinks SymLinksIfOwnerMatch
    <IfModule mod_fcgid.c>
        SetHandler fcgid-script
    </IfModule>
    <IfModule !mod_fcgid.c>
        SetHandler cgi-script
    </IfModule>
</Directory>
[...]
In both code blocks, comment on the "Require all granted" lines and insert the 4-4 lines below them.
Finally, restart Apache:
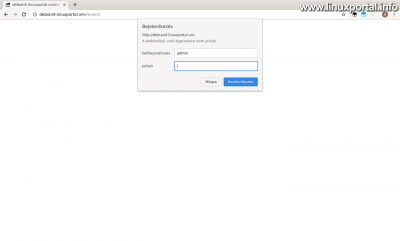
systemctl restart apache2Control
Then, when you refresh your Munin page in your browser, the login panel will accept:
Conclusion
As you can see, the Munin system monitor program is no longer a piece of today, it could be more in the veteran category, but it is still being actively developed today. And even if it's in the Debian repository, it's sure to be useful to many others. There wasn't an update for a while, so I didn't even bother to make a description, but when I saw the newer versions in the Debian 10 and Debian 9 backports, I thought it was worth a little keyboard wear. Of course, there are also much more modern system analysis software, but I have been using this for a long time, I consider it transparent and reliable, so I can safely recommend it to anyone.
- http://munin-monitoring.org/
- http://guide.munin-monitoring.org/en/latest/
- https://packages.debian.org/stretch-backports/munin
- https://packages.debian.org/buster/munin
- GitHub - Munin monitoring - plugins
- GitHub - Munin Monitoring - plugins - pure-ftpd-logs
- Server monitoring with Monit on Debian and Ubuntu systems
- How to install Matomo (formerly Piwik) web analytics software on our Apache server
- Perfect server: Debian 9 (stretch) V1.0
- Perfect server: Debian 10 (Buster) V1.0
- Perfect server: Debian 11 (Bullseye) v1.0
- How to build and arming our ISPConfig3 server and how to secure our control panel, main services and websites with Let's Encrypt SSL
Navigation
- To post registration and login required
- 209 views


